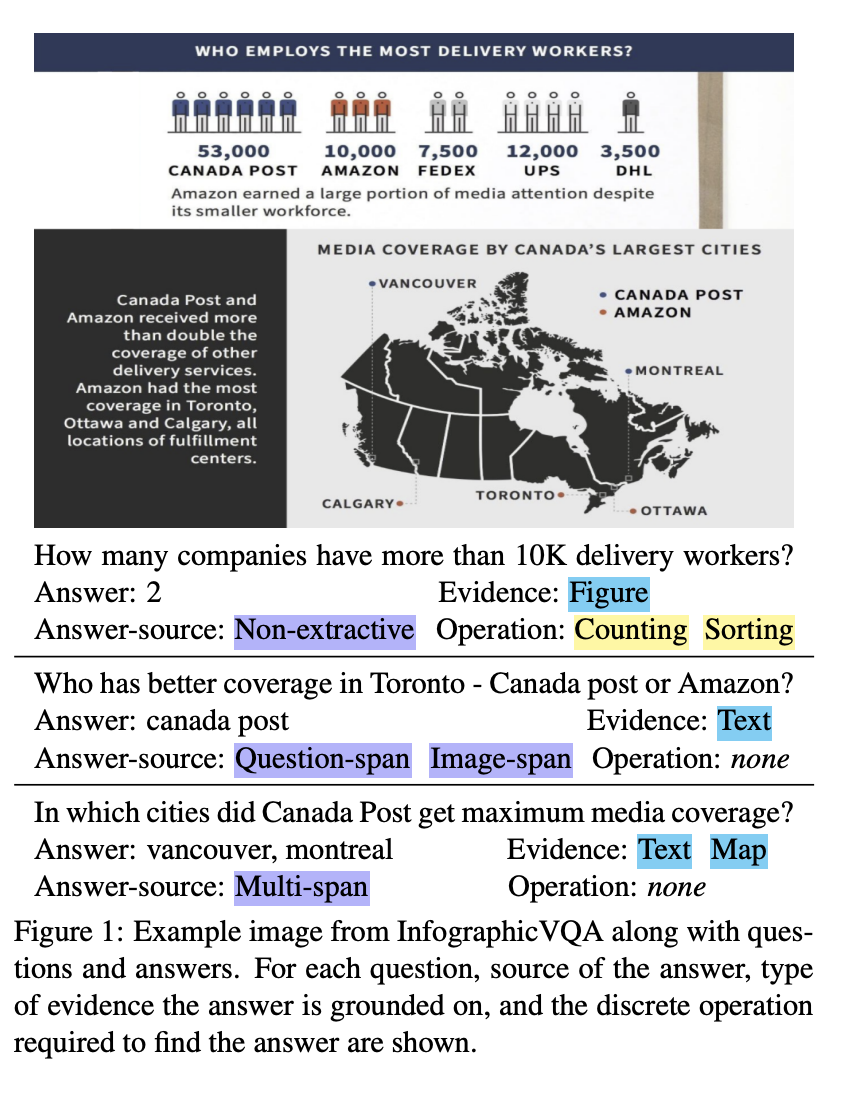
This post is a brief summary about the paper that I read for my study and curiosity, so I shortly arrange the content of the paper, titled InfographicVQA (Mathew et al., arXiv 2024), that I read and studied.

For detailed experiment and explanation, refer to the paper, titled InfographicVQA (Mathew et al., arXiv 2024)
Note(Abstract):
Infographics communicate information using a combination of textual, graphical and visual elements. In this work, we explore automatic understanding of infographic images by using a Visual Question Answering technique. To this end, we present InfographicVQA, a new dataset that comprises a diverse collection of infographics along with question-answer annotations. The questions require methods to jointly reason over the document layout, textual content, graphical elements, and data visualizations. We curate the dataset with emphasis on questions that require elementary reasoning and basic arithmetic skills. For VQA on the dataset, we evaluate two strong baselines based on state-of-the-art Transformer-based, scene text VQA and document understanding models. Poor performance of both the approaches compared to near perfect human performance suggests that VQA on infographics that are designed to communicate information quickly and clearly to human brain, is ideal for benchmarking machine understanding of complex document images. The dataset, code and leaderboard will be made available at docvqa.org
Download URL:
The paper: InfographicVQA (Mathew et al., arXiv 2024)
The paper: InfographicVQA (Mathew et al., arXiv 2024)
Reference
- Paper
- For Your Information
- How to use html for alert
- How to use MathJax