Let’s see this site, scipy lecture
Nowadays, I am studying linear aligebra,So all of a sudden, I want to plot vecor with python
So I’m looking for information that I can plot vector with Python, specifically some library.
What I will make is mainly 2-D vector andn 3-D vector.
First of all, let’s see 2-D vector
befor seeing the following, let’s see sample code from my Reference below executed.
jupyter’s NBviewr : about sample code of vector drawing
2 Dimensional vector
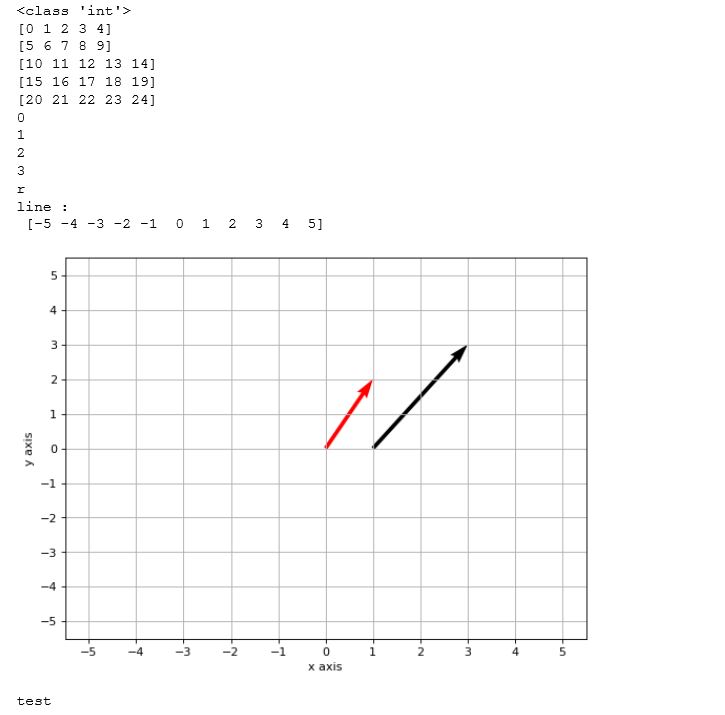
Mainly, I used “quiver” fucntion of matplotlib.
My python code is :
# from now on, I will arrange the vector of 2D

%matplotlib inline

import numpy as np
import matplotlib.pyplot as plt


# if you want to make vec in here, change the following variables

# set np.linspace function

lineSizePositive = 5
lineSizeNegative = -5
numberOfSampleOfLine = lineSizePositive * 2 + 1

# choose one of {'b', 'g', 'r', 'c', 'm', 'y', 'k', 'w'} as vector color
# 'b' : blue, 'g' : green, 'r' : red, 'c' : cyan,
# 'm' : meganta, 'y':yellow, 'k' : black, 'w' : whilte from https://matplotlib.org/api/colors_api.html

vectors  = {"StartingPointOfX" : 0,"StartingPointOfY" : 0,
            "SizeOfXvector" : 1,"StartingPointOfYvector" : 2,
            "VectorColor" : "r"}
vectors2 = {"StartingPointOfX" : 1,"StartingPointOfY" : 0,
            "SizeOfXvector" : 2,"StartingPointOfYvector" : 3,
            "VectorColor" : "k"}

vectorList = [vectors, vectors2]

# if you want to make it better, just use array
# you might need the function meshgrid
# But In my case, just this function for linear algebra. I think I couldn't need it.
x = np.arange(25).reshape(5,5)

a = np.array([0,1,2,3, 'r'])

print (type(34))
for i in x :
     print (i)

for i in a :
     print (i)


#for vec in vectorList :
#    print (vec["StartingPointOfX"]);

def PlotVector(legend=True) :
    # Create a figure of size 8x6 inches, 80 dots per inch
    fig = plt.figure(figsize=(8, 6), dpi=80)

    # for the origin
    #ax = fig.gca()
    #ax.scatter([0],[0],color="k",s=100)

    # line size of each axes
    line = np.linspace(lineSizeNegative, lineSizePositive, numberOfSampleOfLine, endpoint=True, dtype="int")

    # print varialble line
    print ("line : \n {0}".format(line))

    # Set x limits, * 1.1 just express more space for drawing
    xlim = plt.xlim(line.min() * 1.1, line.max() * 1.1)

    # print varialble line
    #print ("xlim : \n {0}".format(xlim))

    # Set x ticks
    xticks = plt.xticks(line)

    # print varialble line
    #print ("xticks : \n {0}".format(xticks))

    # Set x limits, * 1.1 just express more space for drawing
    ylim = plt.ylim(line.min() * 1.1, line.max() * 1.1)

    # print varialble line
    #rint ("ylim : \n {0}".format(ylim))

    # Set x ticks
    yticks = plt.yticks(line)

    # print varialble line
    #rint ("yticks : \n {0}".format(yticks))

    # set label name of x axis
    plt.xlabel("x axis")

    # set label name of y axis
    plt.ylabel("y axis")

    # set grid of coordinate to True
    plt.grid(linestyle = "-")

    # choose one of {'b', 'g', 'r', 'c', 'm', 'y', 'k', 'w'} as vector color
    # 'b' : blue, 'g' : green, 'r' : red, 'c' : cyan,
    # 'm' : meganta, 'y':yellow, 'k' : black, 'w' : whilte from https://matplotlib.org/api/colors_api.html

    for vec in vectorList :
        vecs = plt.quiver(vec["StartingPointOfX"], vec["StartingPointOfY"], vec["SizeOfXvector"], vec["StartingPointOfYvector"]
                  , angles="xy", scale_units="xy",scale=1, color=vec["VectorColor"])
        #if (legend) :
            #plt.legend(["The origin",r'$\vec a$',"test 2"])

    plt.show()


PlotVector()

if __name__ == "__main__" :
        print ("test")
the below is the reuslt of execution of the above code on jupyter notebook.
if you want to see excution of the above code on NBviewer of jupyter, click this, 2D-vector.
3 Dimensional vector
%matplotlib inline

from mpl_toolkits.mplot3d import Axes3D
import matplotlib.pyplot as plt
import numpy as np


fig = plt.figure()
ax = fig.gca(projection='3d')


#dibujar cubo
r = [-1, 1]
for s, e in combinations(np.array(list(product(r,r,r))), 2):
    if np.sum(np.abs(s-e)) == r[1]-r[0]:
        ax.plot3D(*zip(s,e), color="b")

#dibujar punto
ax.scatter([0],[0],[0],color="g",s=100)


class Arrow3D(FancyArrowPatch):
    def __init__(self, xs, ys, zs, *args, **kwargs):
        FancyArrowPatch.__init__(self, (0,0), (0,0), *args, **kwargs)
        self._verts3d = xs, ys, zs

    def draw(self, renderer):
        xs3d, ys3d, zs3d = self._verts3d
        xs, ys, zs = proj3d.proj_transform(xs3d, ys3d, zs3d, renderer.M)
        self.set_positions((xs[0],ys[0]),(xs[1],ys[1]))
        FancyArrowPatch.draw(self, renderer)
print ("ingrese coordenada inicial")
#m=float(raw_input())
a = Arrow3D([0,0],[0,1],[0,0], mutation_scale=20, lw=1, arrowstyle="-|>", color="k")
b = Arrow3D([0,-1],[0,0],[0,0], mutation_scale=20, lw=1, arrowstyle="-|>", color="r")
c = Arrow3D([0,0],[0,0],[0,1], mutation_scale=20, lw=1, arrowstyle="-|>", color="b")
d = Arrow3D([0,0],[0,0],[0,-1], mutation_scale=20, lw=1, arrowstyle="-|>", color="g")
e = Arrow3D([0,1],[0,0],[0,0], mutation_scale=20, lw=1, arrowstyle="-|>", color="c")
f = Arrow3D([0,0],[0,-0.5],[0,0], mutation_scale=20, lw=1, arrowstyle="-|>", color="m")

ax.add_artist(a)
ax.add_artist(b)
ax.add_artist(c)
ax.add_artist(d)
ax.add_artist(e)
ax.add_artist(f)
plt.show()
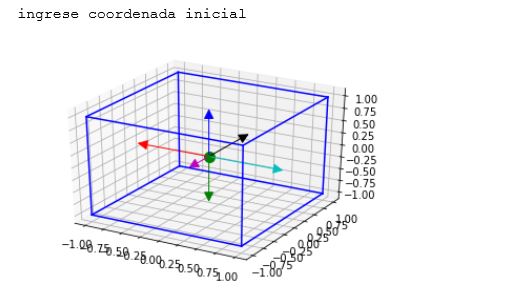
the figure of exectuing the above code :
if you want to see the code on jupyter NBviewer, click NBviwer link
later on, I will extend this codes to make it easy to use for Linear algebra.
Reference
for the overall lecture of scipy
for 2D vector
for 3D vector
for 3D plane
for annotating vector
for lecture of matplotlib

